Practice Set: Interactions
Multiple Regression
Let’s take a look at the iris data set!
##   Sepal.Length Sepal.Width Petal.Length Petal.Width Species
## 1          5.1         3.5          1.4         0.2  setosa
## 2          4.9         3.0          1.4         0.2  setosa
## 3          4.7         3.2          1.3         0.2  setosa
## 4          4.6         3.1          1.5         0.2  setosa
## 5          5.0         3.6          1.4         0.2  setosa
## 6          5.4         3.9          1.7         0.4  setosa
## Sepal.Length Sepal.Width Petal.Length Petal.Width
## Min. :4.300 Min. :2.000 Min. :1.000 Min. :0.100
## 1st Qu.:5.100 1st Qu.:2.800 1st Qu.:1.600 1st Qu.:0.300
## Median :5.800 Median :3.000 Median :4.350 Median :1.300
## Mean :5.843 Mean :3.057 Mean :3.758 Mean :1.199
## 3rd Qu.:6.400 3rd Qu.:3.300 3rd Qu.:5.100 3rd Qu.:1.800
## Max. :7.900 Max. :4.400 Max. :6.900 Max. :2.500
## Species
## setosa :50
## versicolor:50
## virginica :50
##
##
## You Try!
- Build a multiple regression model with
Petal Lengthas the outcome andSepal LengthandSepal Widthas predictors. - Name it
mod_cont.
Let’s interpret those coefficients!
- What does the estimate for the intercept mean?
- What do the coefficients for each variable mean?
- If the Estimate for Sepal Length was 2 and the Standard Error was 0.5, what would the t-value be?
- What do the p-values mean?
- What does the \(R^2\) stand for?
You try!
- Let’s build a multiple regression model with Petal Length as the outcome and Sepal Length and Species as predictors.
- Name it
mod_cat.
Let’s interpret those coefficients!
- What is the reference (base) category?
- What does the estimate for the intercept mean?
- What do the coefficients for each variable mean?
Continuous Predictors Interacting
You try!
- Let’s build a regression model with Petal Length as the outcome and Sepal Length and Sepal Width as predictors that interact.
- Name it
mod1. - We’ll reference
mod1throughout the assignment, so don’t forget what it stands for!
Let’s interpret those coefficients!
- What does the estimate for the intercept mean?
- What do the coefficients for each variable mean?
- What happened to the coefficient of Sepal Length compared to the multiple regression model
mod_cont?
Quick Quiz
☝️ Good job! You can work with continuous variable interactions!
Simple Slopes
A great way of understanding interactions is by visualizing them!
Example 1:
First, choose which package you want to use. We’ll start with sjPlot.
library(sjPlot)Plug in your regression model(we’ll use mod1) and plot the interaction!
plot_model(mod1, type = "pred",terms = c("Sepal.Width","Sepal.Length"))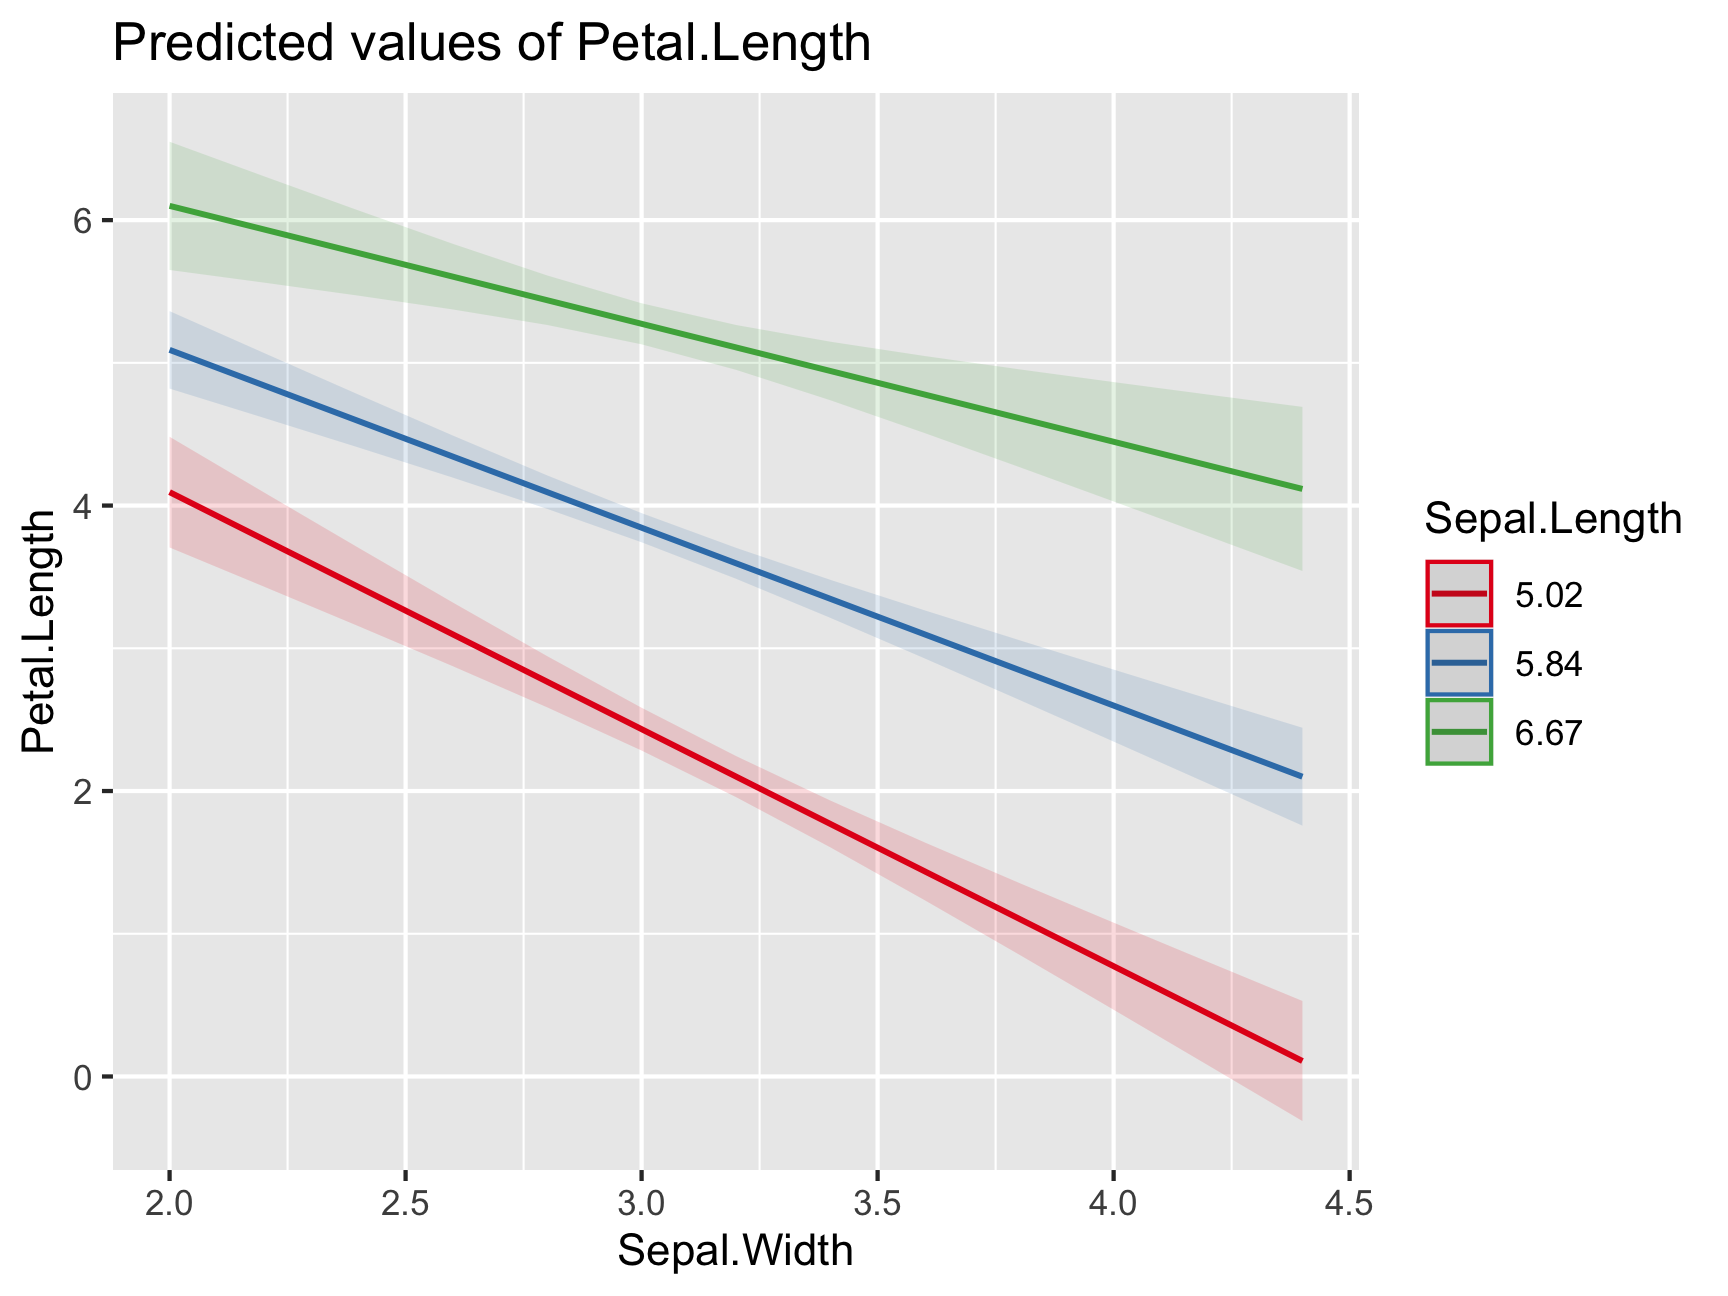
Now, we’ll look at these interactions for mod1 when Sepal.Width equals 2 and 3.
plot_model(mod1, type = "pred", terms = c("Sepal.Width", "Sepal.Length[2,3]"))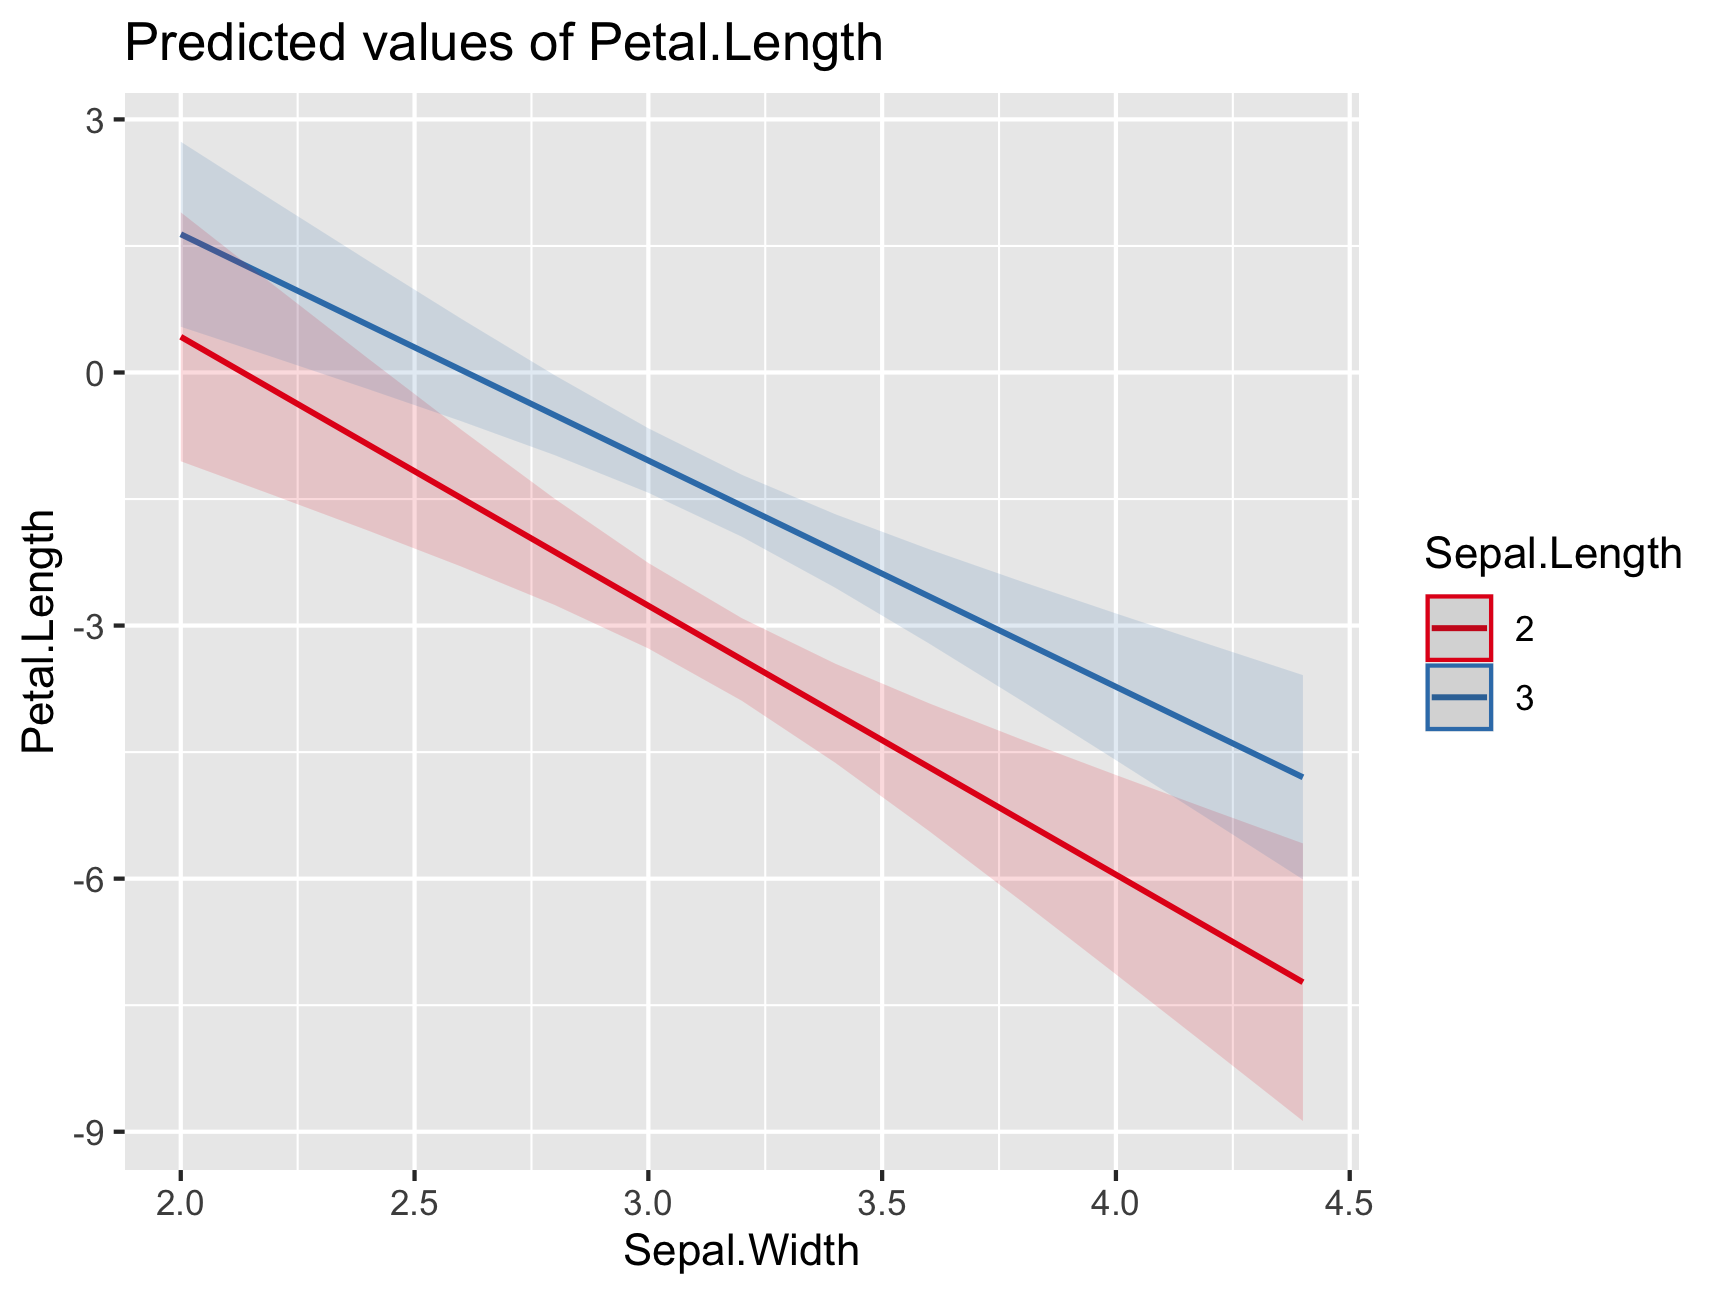
You try!
- Let’s visualize this model:
Sepal.Width ~ Sepal.Length*Petal.Lengthusing thesjPlotpackage - Name your regression model
mod_width - Then let’s visualize this models when
Sepal.Lengthis 4 and 6
Let’s look at these interactions across Species. For this, we’ll need to create a new regression model first.
mod1_species<-lm(Petal.Length~Sepal.Length*Sepal.Width+Species, data=iris)

plot_model(mod1_species, type = "pred", terms = c("Sepal.Length", "Sepal.Width", "Species"))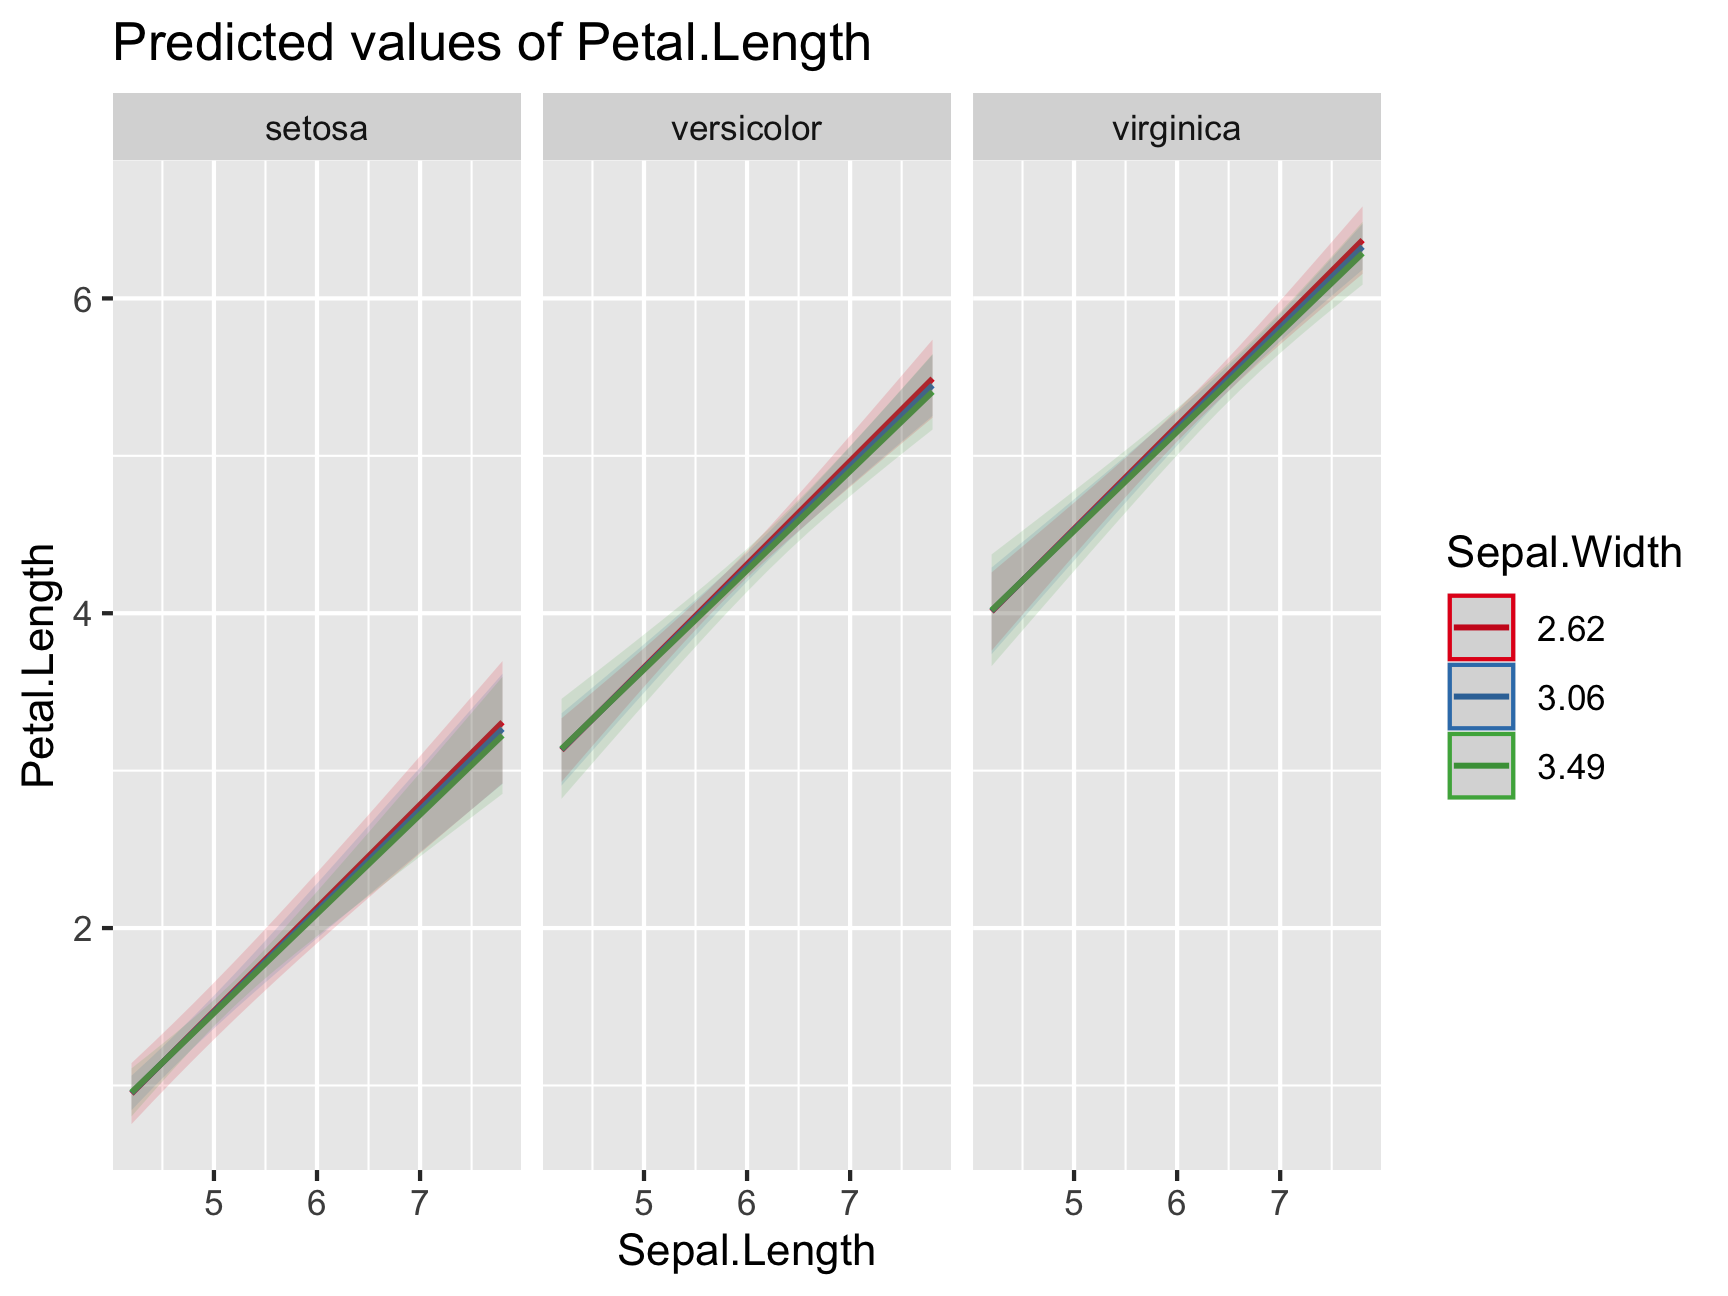
Example 2:
There are many ways of exploring an interaction. Now we’re going to try using the reghelper package to look at the significance of our simple slopes at specific levels.
Using mod1, let’s see if Sepal Width is a significant predictor of Petal Length at different levels of Sepal Length (specifically when Sepal Length is 5 and 6).
simple_slopes(mod1, levels = list(Sepal.Length = c(5,6)))## Sepal.Length Sepal.Width Test Estimate Std. Error t value df Pr(>|t|) Sig.
## 1 5 sstest -1.6709 0.1631 -10.2436 146 < 2.2e-16 ***
## 2 6 sstest -1.1652 0.1326 -8.7874 146 3.842e-15 ***# what do these results mean?You try!
- Now let’s see if Sepal Length is a significant predictor of Sepal Width at different levels of Petal length (specifically when Petal Length is 4 and 6).
- Please use the
reghelperpackage - HINT: check slide 53
Example 3:
Just like how there are many ways of exploring simple slopes, there are also many ways of visualizing interactions!
Let’s visualize mod1 using the package ggeffects.
predict<- ggpredict(mod1, terms =
                      c("Sepal.Width","Sepal.Length"))

plot(predict)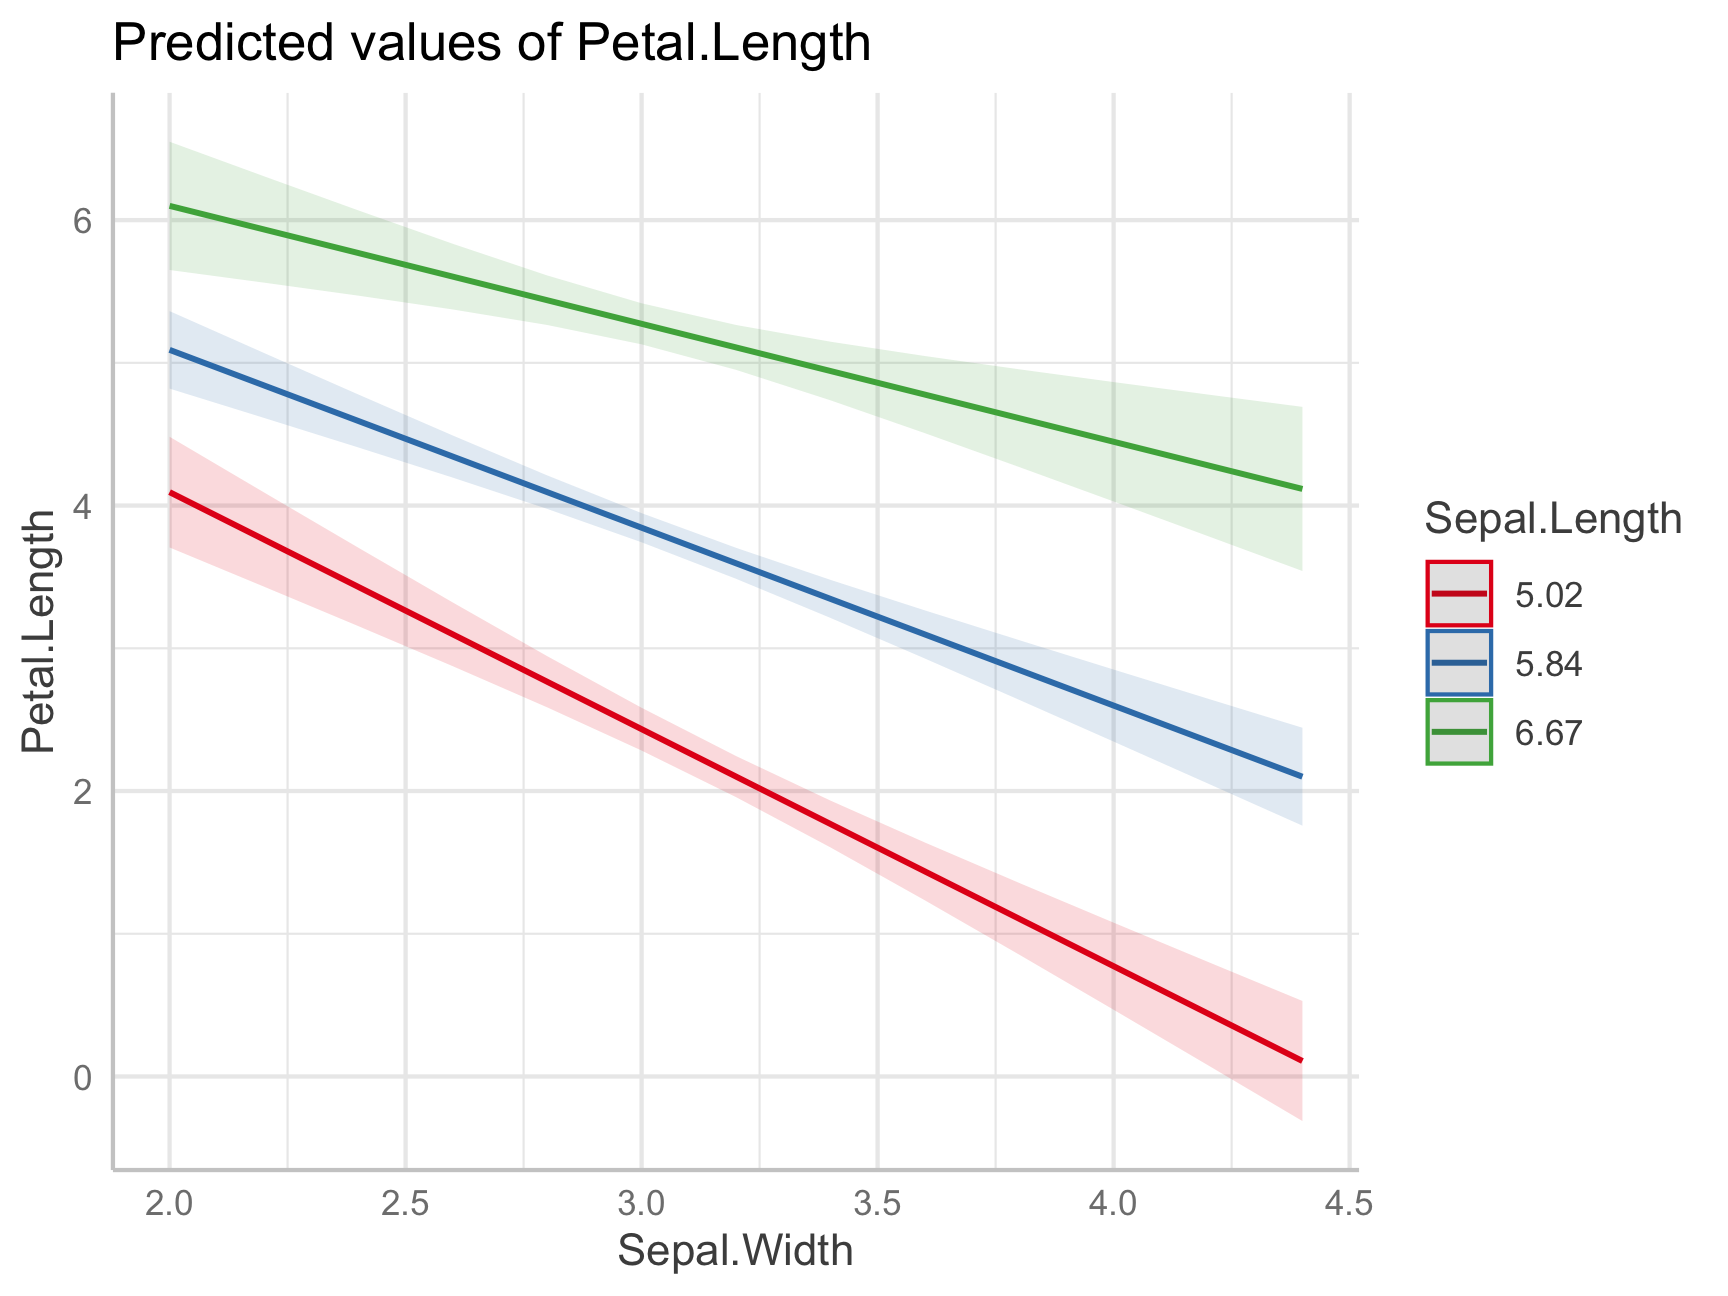
There’s something cool about this function, though. Check out the data that ggpredict creates!
predict## # Predicted values of Petal.Length
##
## # Sepal.Length = 5.02
##
## Sepal.Width | Predicted | 95% CI
## ---------------------------------------
## 2.00 | 4.09 | [ 3.71, 4.48]
## 2.40 | 3.43 | [ 3.16, 3.70]
## 2.80 | 2.77 | [ 2.59, 2.95]
## 3.20 | 2.10 | [ 1.96, 2.25]
## 3.60 | 1.44 | [ 1.23, 1.64]
## 4.40 | 0.11 | [-0.31, 0.53]
##
## # Sepal.Length = 5.84
##
## Sepal.Width | Predicted | 95% CI
## --------------------------------------
## 2.00 | 5.09 | [4.82, 5.36]
## 2.40 | 4.59 | [4.41, 4.78]
## 2.80 | 4.09 | [3.98, 4.21]
## 3.20 | 3.60 | [3.49, 3.70]
## 3.60 | 3.10 | [2.93, 3.27]
## 4.40 | 2.10 | [1.76, 2.44]
##
## # Sepal.Length = 6.67
##
## Sepal.Width | Predicted | 95% CI
## --------------------------------------
## 2.00 | 6.10 | [5.65, 6.55]
## 2.40 | 5.77 | [5.47, 6.07]
## 2.80 | 5.44 | [5.27, 5.61]
## 3.20 | 5.11 | [4.95, 5.27]
## 3.60 | 4.78 | [4.51, 5.05]
## 4.40 | 4.12 | [3.54, 4.69]What does this output mean?
Make it pretty!
- Let’s visualize
mod_widthusing the same package! - This time, set color palette to “eight”
- Here’s a nice website for reference https://strengejacke.github.io/ggeffects/reference/plot.html
What is this graph telling you?
Massive shout out to the Fall 2022 AI Selin Toprakkiran for creating this excellent Practice Set!